Example problem: Rendering the Administer page is very slow - it takes upwards of 20 seconds on a development machine without any load.
Solution
Browsing Drupal forums, you will find plenty of theories and more or less helpful tips. However, it is usually more productive to work from first principles, that is, according to the general approach described below.
Begin by enabling query and page build time logging in Devel module's configuration. For extra certainty, also enable query logging in the MySQL server. If the problematic page's queries execute fast, the problem must lie somewhere in the PHP code. PHP code can be easily profiled using the XDebug profiler. After installing the XDebug extension, simply enable the profiler by adding the following in xdebug.ini:
xdebug.profiler_output_dir=/tmp
xdebug.profiler_enable=1
(Beware of doing it in production environment; profiling tends to be resource-intensive.)
Restart Apache, reload the problematic page and wait until it finishes rendering. You will see that the profile /tmp/cachegrind.out.nnnn with execution time/count measurements was created. The profiler can now be disabled unless more data is required.
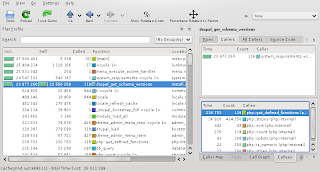
Inspect the profile by opening it with KCachegrind:

In the above screenshot KCachegrind pinpoints the function drupal_get_schema_versions as consuming almost 24 of the total 27 seconds execution time. A quick Google search reveals that this performance problem has been observed and solved for Drupal 7. After a quick-and-dirty test that disabling that function indeed fixes the performance problem, you can pursue the issue further, for example by adapting the most recently submitted patch to your installation. (Take into account the increased cost for future upgrades if you follow that route.)
Update: another (more modern?) approach to profiling Drupal (applicable to D6 and D7) is using the XHProf extension, which captures profile dump files and lets you view them through the browser. It doesn't seem to offer much advantage in terms of features, but integrates with Drupal a bit better. The required setup steps are as follows:
- Install XHProf extension using pecl and add extension=xhprof.so to php.ini. Pay attention to the directory where xhprof_html was installed (e.g. in /usr/share/php).
- Set up a URL alias in your web server to serve *.php from /usr/share/php/xhprof_html (for example)
- Go to /admin/settings/devel of your Drupal site, enable XHProf profile dumps, point it to /usr/share/php and to the URL alias set up in the previous step.
- On each page request you should now see a new profile dump file created in /tmp, such as /tmp/md5sum.nameofyoursite.
- At the bottom of every page you should see a link to the URL alias for viewing the corresponding profile dump, e.g. http://whatever/xhprof_html/index.php?run=md5sum&source=nameofyoursite


No comments:
Post a Comment